Every developer has a story like this: you come in Monday morning only to discover that a critical job or service silently failed on Friday. No alerts. No errors. The process just… didn’t run. Maybe the server rebooted, maybe something updated, maybe there’s an exception causing the script to fail. The common thread is that nobody knows until the damage is done–missing data, grumpy partners, annoyed managers, and a weekend’s worth of poop to shovel.
Most monitoring solutions handle the obvious cases well. If a job runs and fails loudly, you get an alert. If a job runs and succeeds, you get a nice green checkmark. However, what about the job that never ran at all? That’s the third state–the silent failure–and it’s surprisingly hard to reliably detect.
This article walks through building a monitoring system designed around that problem. The core insight is simple: you can’t just track what happened; you also have to track what should have happened.
The Problem
Before this system existed, we had the typical issues that surround automated processes:
- Silent failures: Jobs dying without any indication
- Jobs running for too long or hanging: No visibility into duration or completion
- No centralized view: Different teams or individuals using different approaches leading to tribal knowledge about what should be running and when.
Those who care about these problems span the entire organization: developers, systems administrators, management, operations, and even external customers waiting on deliverables that never arrive.
At its core, the problem wasn’t failure–it was uncertainty. We needed something that could answer a simple question: is everything running the way it should be?
Three Outcomes
Most monitoring systems model job status as a binary true/false indicating success or failure. I added a third state which is one of the defining factors for this system.
| Outcome | Meaning |
|---|---|
| Success | The job ran and reported successful completion |
| Failure | The job ran, encountered an error, and reported its own failure |
| Missed | The job never reported in at all (detected by the system, not the job) |
The first two are straightforward, you’re reacting to something that happened. The third is different and trickier to solve. You’re detecting the absence of an expected event, which means you need to know what was expected in the first place. This distinction is what ultimately drove the architecture of this monitoring system.
Architectural Overview
The system has six main components:
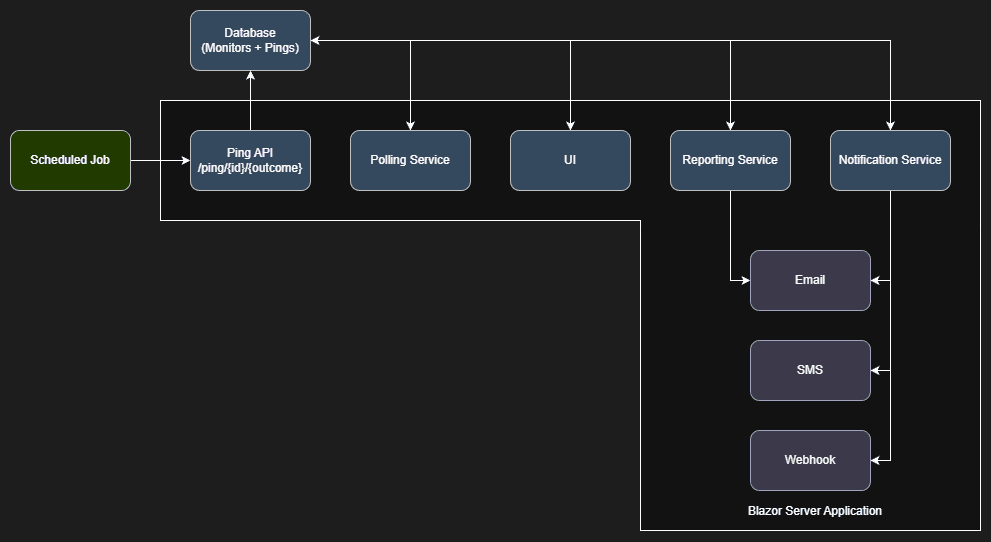
- Database: Storage that acts as the system of record for both expectations (schedules and grace periods) and observations (outcomes, ping history, and additional logging information).
- UI: A Blazor application that provides monitor configurations, ping history, and real-time visibility and metrics.
- Ping API Endpoint: A simple REST endpoint that jobs call to report their status. This is the only integration point for monitored processes.
- Polling Service: Runs every minute (which is the shortest amount of time a cron expression supports) and evaluates each monitor’s state and triggers notifications when required.
- Reporting Service: Runs every minute and provides ad hoc and scheduled reports on monitor health and ping history.
- Notification Service: Dispatches queued alerts via email (easily extensible to SMS, Slack, Discord, etc) based on per-monitor rules.
The design philosophy is “dead simple integration.” Any process that can make an HTTP call to an anonymous endpoint can participate in monitoring. No need for SDKs, agents, or dependencies. Let’s take a look at each component.
Ping API Endpoint
Jobs report their status by calling a single endpoint provided by the UI:
POST /ping/{monitorId}/{outcome}
Where outcome is success or failure and that’s it. A minimal integration looks like:
public async Task RunJobAsync()
{
    try
    {
        // Do the actual work
        await ProcessDataAsync();

        // Report success
        await _httpClient.PostAsync($"https://monitor.example/ping/{_monitorId}/success", null);
    }
    catch (Exception ex)
    {
        // Report failure
        await _httpClient.PostAsync($"https://monitor.example/ping/{_monitorId}/failure", null);
        throw; // Rethrow so the scheduler still marks the job as failed
    }
}
For jobs that want to include additional context, the endpoint accepts an optional request body with log information in string format:
var content = new StringContent(JsonSerializer.Serialize(new
{
    RecordsProcessed = 1547,
    Duration = stopwatch.Elapsed.TotalSeconds,
    Notes = "Batch completed with 10 warnings"
}), Encoding.UTF8, "application/json");

await _httpClient.PostAsync($"https://monitor.example/ping/{_monitorId}/success", content);
This optional payload gets stored with the ping record which is useful for debugging or historical analysis without requiring a separate logging system. Detecting success and failure pings is trivial: query for any pings since the last polling cycle and process them accordingly.
Polling Service
This is where it gets interesting. A missed ping isn’t an event, it’s the absence of an expected event. You can’t query for something that doesn’t yet exist. Instead, you have to:
- Know when a ping should have occurred,
- Check whether one actually did and,
- Account for acceptable timing variance.
Knowing When to Expect a Ping
Each monitor has a schedule defined as a cron expression. When the polling service runs, it needs to answer: “Given this monitor’s schedule, when was the most recent expected ping?”
I used the NCrontab .NET library to parse cron expressions and calculate occurrence times which makes it quite simple:
public DateTime? GetLastExpectedRun(string cronExpression, DateTime asOfDate)
{
    var schedule = CrontabSchedule.Parse(cronExpression);

    // Get occurrences in a reasonable lookback window
    var lookbackStart = asOfDate.AddDays(-1);
    var occurrences = schedule.GetNextOccurrences(lookbackStart, asOfDate).ToList();

    return occurrences.LastOrDefault();
}
For a monitor scheduled to run every hour (0 * * * *), this tells me the last expected run was at the top of the most recent hour which I then store in monitor.NextPing for easy access later.
The Grace Period Problem
Real-world job execution gets messy. A job scheduled for 8:00 AM might actually run at 8:00:03 due to scheduler latency. Alternatively, it might run at 7:59:58 because the triggering system’s clock is slightly ahead. You need tolerance for this variance which seems simple enough. My initial implementation was straightforward: look for pings within [scheduled_time, scheduled_time + grace_period]. If a ping exists in that window, the monitor is healthy. If not, it’s missed.
This worked until the systems administrator asked me why a monitor was reporting missed even though the job was clearly running. The job was scheduled to run every hour, and it was pinging in with success regularly. The problem? The process was checking in a few seconds before the scheduled time outside my detection window.
He could have worked around it by shifting the expected schedule back a minute and adjusting the grace period. But that felt like a gross workaround. The user’s mental model was “this job runs every hour” so why should they have to lie to the system about the schedule to accommodate timing variance in either direction? Likewise, wouldn’t that just create more confusion for others looking at it and foster another tribal knowledge ecosystem?
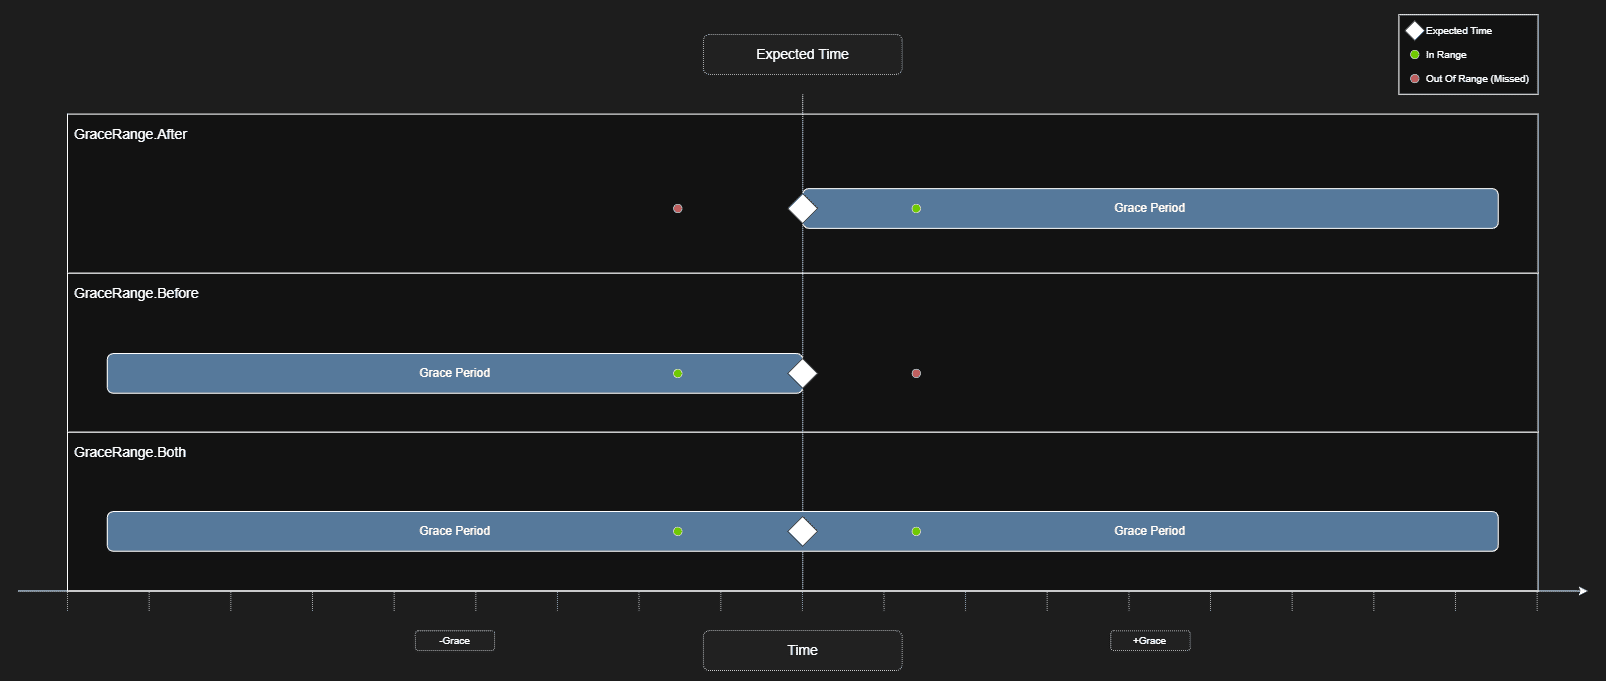
To solve this issue, I went with was adding a Grace Range enumeration. This enumeration’s purpose is to control how the grace period is applied to a schedule.
public enum GraceRange
{
    Before,  // Look for pings in [scheduled - grace, scheduled]
    After,   // Look for pings in [scheduled, scheduled + grace]
    Both     // Look for pings in [scheduled - grace, scheduled + grace]
}
The evaluation logic then builds a time window around the expected run and checks for any matching pings before declaring the job missed. The logic looks something like:
var now = DateTime.Now;
var graceMinDate = monitor.NextPing ?? now;
if (monitor.GraceMode == GraceRange.Before || monitor.GraceMode == GraceRange.Both)
    graceMinDate = graceMinDate.AddSeconds(-monitor.GraceInSeconds);

var graceMaxDate = monitor.NextPing ?? now;
if (monitor.GraceMode == GraceRange.Both|| monitor.GraceMode == GraceRange.After)
    graceMaxDate = graceMaxDate.AddSeconds(monitor.GraceInSeconds);

var lastPing = await databaseContext.Pings.Include(x => x.Monitor).FirstOrDefaultAsync(x => x.ReceivedOn >= graceMinDate && x.ReceivedOn <= graceMaxDate && x.Monitor.Id.Equals(monitor.Id));
if (lastPing != null)
{
    // We found a ping that matches the range, calculate the next ping date/time and move on
}
else if (graceMaxDate <= now)
{
    // We've exceeded the expected ping date/time, create a missed ping
    // Add the ping to the notification queue
}
Most monitors use GraceRange.After as it’s the most intuitive model but the option exists for processes that consistently run slightly early or for cases where you genuinely don’t care about minor timing variance in either direction.
Performance At Scale
We currently run somewhere in the ballpark of 250+ monitors in production, many of which receive pings every minute. When you have volume like that, efficiency matters. A few things that keep the polling service fast:
- Batch evaluation: Rather than querying pings per-monitor, I pull all pings since the last polling cycle in a single query and group them in memory. It’s important to do as much as possible during the query state before materialization for the best performance.
- Skip monitors not ready for evaluation: If a monitor’s grace window hasn’t closed yet, or its schedule falls outside of the current run, skip it entirely. No point checking for pings before you’ve given the job a chance to report in.
- Proper database indexing: Ensuring the database has proper indexes on common query patterns will have a significant impact on the performance of the system.
Notification Service
Each monitor can define notification rules per outcome. The entity looks roughly like:
public abstract class Notification
{
    public Guid Id { get; set; }
    public Outcome Outcome { get; set; }
    public abstract string TargetName { get; }
    public abstract string TargetData { get; }

    public abstract Task SendAsync(Monitor monitor, Ping ping);
}
Which can then be easily extended to multiple notification classes for a variety of notification types:
public class NotificationSMTP : Notification
{
    public string EmailAddress { get; set; }
    public override string TargetName => "Email";
    public override string TargetData => string.IsNullOrWhiteSpace(this.EmailAddress) ? "N/A" : this.EmailAddress;

    public override Task SendAsync(Monitor monitor, Ping ping)
    {
        // Implementation for sending email notification
    }
}
public class NotificationSMS : Notification
{
    public string PhoneNumber { get; set; }
    public override string TargetName => "SMS";
    public override string TargetData => string.IsNullOrWhiteSpace(this.PhoneNumber) ? "N/A" : this.PhoneNumber;

    public override Task SendAsync(Monitor monitor, Ping ping)
    {
        // Implementation for sending SMS notification
    }
}
public class NotificationWebhook : Notification
{
    public string Url { get; set; }
    public override string TargetName => "Webhook";
    public override string TargetData => string.IsNullOrWhiteSpace(this.Url) ? "N/A" : this.Url;

    public override Task SendAsync(Monitor monitor, Ping ping)
    {
        // Implementation for sending webhook notification
    }
}
When the polling service detects an outcome that needs alerting, it looks up the matching rules and fires each notification defined:
var notifications = databaseContext.Notifications.Where(x => x.MonitorId == monitor.Id && x.Outcome == outcome).ToList();

foreach (var notification in notifications)
{
    await notification.SendAsync(monitor, ping);
}
This design makes adding new notification channels trivial. When someone inevitably asks for Slack or Teams integration, it’s just a new class that inherits from Notification and implements SendAsync. The “if-defined” model also means you only get notified about what you care about. Most monitors don’t need a notification on success–but some do, particularly for critical jobs where silence itself is suspicious.
Reporting Service
Since I already had the infrastructure for cron-based scheduling, I extended it to support scheduled reports. Users can build queries through a UI that generates dynamic LINQ expressions against the ping history:
- “Show me all missed pings in the last 7 days”
- “Show me monitors with more than 5 failures this month”
- “Show me average ping latency by monitor”
These reports can run on-demand or be scheduled for delivery via email using the same cron expression parser that drives monitor evaluation. It was a relatively small addition that I feel significantly increased the system’s value for stakeholders who wanted regular summaries without logging into the UI. I personally have reports set up to notify me weekly when polling is disabled on monitors to make sure something isn’t being accidentally ignored.
Build vs. Buy
Well because I love programming–we did evaluate other options first though! Before building this, I evaluated existing solutions. The main contenders were healthchecks.io and cronitor.io, both are solid products that do their jobs well but they didn’t fit our needs for several reasons:
- Stack familiarity: While some of the services were available open source, they used tech stacks that were unfamiliar to the development team, and would require we host infrastructure that was unfamiliar to the systems team. Building ourselves allowed us to build in the same tech stack our teams are used to for easier maintenance and debugging later down the line.
- Pricing model: Most services charge per monitor or have tier-based limits. With 250+ monitors and growing, the cost would add up quickly. A self-hosted solution has a fixed infrastructure cost regardless of scale.
- Notification flexibility: We needed specific notification routing (different people for different monitors, different channels for different outcomes) that wasn’t fully supported out of the box.
- Additional logging: The ability to attach arbitrary context to each ping was important for debugging. Most services treat pings as pure heartbeats without payload support.
- On-premise requirement: There was strong preference for hosting internally rather than sending monitoring data to a third party.
None of these are criticisms of the existing products—they’re excellent for many use cases. They just didn’t align with our specific requirements and constraints.
The Stack
For those interested in the implementation details:
- Framework: Blazor Server on .NET 8
- Database: SQL Server with Entity Framework Core (easily swappable thanks to EF’s provider abstraction).
- Cron Parsing: NCrontab for expression parsing and occurrence calculation and Cron Expression Descriptor to convert cron expressions to human-readable descriptions for the UI.
- Hosting: IIS on Windows Server
- Languages: C# for backend, minimal JavaScript for UI interactivity such as copy/paste functionality.
Closing Thoughts
The core insight that drove this project–detecting what should have happened but didn’t… sounds obvious in retrospect. Most monitoring focuses on reacting to events, not detecting their absence.
If I were building this again, I’d probably start with the grace range flexibility from day one rather than discovering the need in production. I likely would also investigate anonymous vs tokenized access to the ping endpoint–not much of a concern for on-premise internal use but should the system face the public, it would be far more imperative for security and reliability.
The system has been running for a couple years now with minimal maintenance and has quickly become a cornerstone to our automation operations. The few day investment paid off many times over in avoided incidents, faster debugging via additional data, and better visibility into running processes. If you’re dealing with similar problems–silent failures, unreliable scheduled jobs, no visibility into what’s running–the approach outlined here might be worth considering. The patterns are straightforward, and the infrastructure requirements are minimal.
